Socitm Says podcast
Using social progress index data with William Barker and Michael Green
This episode of the podcast is a comprehensive exploration of data, the social progress index (SPI), and how one size does not fit all when trying to use it in your local authority.
FAQ
General Understanding
What is the Social Progress Index, and how is it calculated?
Social Progress is defined as: “The capacity of a society to meet the basic human needs of its citizens, establish the building blocks that allow citizens and communities to enhance and sustain the quality of their lives, and create the conditions for all individuals to reach their full potential.” The Social Progress Index is a composite indicator to measure Social Progress.
What is a composite indicator?
A composite indicator is a single index that combines multiple individual indicators into one overall score. It provides a simplified, aggregate measure of a complex concept that cannot be captured by a single variable.
What is the power of a composite indicator?
The power of a composite indicator lies in its ability to condense complex, multidimensional information into a single, interpretable value – making it easier to understand, compare, and act on issues that would otherwise be too complicated to grasp quickly.
Each local authority’s SPI score is made up of three overarching dimensions—Basic Human Needs, Foundations of Wellbeing, and Opportunity—each composed of four components, making a total of 12 components and dozens of underlying indicators.
What does the score mean in the Social Progress Index? For example, what does a score of 40/50/60 out of 100 mean?
The score represents the relative performance of the Local Authority against all other local authorities, so for example:
40 – weak social progress
50 – expected social progress
60 – strong social progress
Relative performance means that a local authority’s composite score reflects how it compares to others in the same group, not its absolute values. For example, if a local authority has lower crime, higher life expectancy, and better KS2 outcomes than most, it will rank higher because it performs better relative to its peers across those indicators.
How often is the data updated, and what years are available?
The data is updated annually. For the Social Progress Index, data is available for the years 2021, 2022, and 2023, with 2024 currently being added. The Databank includes data from 2019 to 2023, although some indicators only have data for a single year.
How many indicators are there in total?
There are 55 different indicators which make up the Social Progress Index.
How is the Social Progress Index different from other socio-economic indices?
The SPI measures outcomes—like safety, education, and health—rather than inputs like spending. It excludes economic indicators such as GDP, focusing instead on how well societies meet people’s real needs. Designed to be actionable, it highlights where improvements are needed and how to achieve them, making it both a measurement tool and a roadmap for change.
Using the Platform
How do I select a specific region, and what happens when I do?
Regional analysis is important because it reveals the unique challenges and inequalities that exist within a country. Each region may face distinct issues, such as poor healthcare access, high unemployment, or environmental stress, requiring tailored solutions. By understanding these local variations, policymakers and organizations can design more targeted, effective interventions and ensure that all communities benefit from social and economic progress.
On the Map page:
Click on Region Filter and select or search your desired region.
This allows you to see and compare social progress in the different local authority districts within a region.
In the Charts, go to Geographic Comparison:
Here you can select the desired regions under the Region dropdown list.
You can compare using the Table, Bar Chart or Scatter Plot
What do the different tabs (‘Basic Human Needs,’ ‘Foundations of Wellbeing,’ ‘Opportunity,’ etc.) mean?
The Social Progress Index is organised into three core dimensions—Basic Human Needs, Foundations of Wellbeing, and Opportunity—each made up of four components, for a total of 12 components and 55 indicators. Each component answers a guiding question about people’s quality of life.
- Basic Human Needs: How well are people’s essential needs being met?
- Nutrition & Basic Medical Care
- Water & Sanitation
- Shelter
- Personal Safety
- Foundations of Wellbeing: Are people living healthy, informed, and sustainable lives?
- Access to Basic Knowledge
- Access to Information & Communications
- Health & Wellness
- Environmental Quality
- Opportunity: Do people have the freedom and resources to reach their full potential?
- Personal Rights
- Personal Freedom & Choice
- Inclusiveness
- Access to Advanced Education
You’ll also find a Databank tab, which includes additional UK policy-relevant data that doesn’t fit directly into the SPI framework. This broader evidence base helps decision-makers align social goals with economic realities, better target interventions, and tackle root causes—not just symptoms.
Can I view historical trends for a region, or is this only for the selected year?
-On the Map view for Social Progress Index, you can view data for 2021, 2022 & 2023.
-On the Map view for Databank, you can view data from 2019-2023 (although certain indicators only have data for 1 year).
-On the Charts, under Year Comparison, you can compare historical trends using the table or line chart for data from 2021-2023 for Social Progress Index, and 2019-2021 for Databank.
Is there a way to export this data for further analysis?
No, this function is not available but please contact us at admin@impera-analytics.com for a specific case.
Can I apply multiple filters at once (e.g., by region and a specific social progress indicator)?
Yes! On the Map view, select on the Indicator dropdown list to select your desired indicator and then proceed to select a region from the Region filter
Is there a tutorial or user guide to help me understand the tool better?
We are currently working on recording self-paced training on Place Insight, which goes through how to navigate the site and get the most out of it!
For now, refer to the Knowledge Base and contact admin@impera-analytics.com for more support.
Am I allowed to share insights from the tool in public-facing reports?
You’re welcome to use insights and outputs from Place Insight in public-facing reports, provided that you don’t include our platform’s visuals or charts directly. Summarised findings and aggregated insights are absolutely fine to include. Feel free to contact admin@impera-analytics.com for more information and specific use-cases.
Data & Insights
What specific indicators are included in the Social Progress Index?
The Social Progress Index is built around three main dimensions, each containing four components:
- Basic Human Needs includes: Nutrition & Basic Medical Care, Water & Sanitation, Shelter, and Personal Safety.
- Foundations of Wellbeing includes: Access to Basic Knowledge, Access to Information & Communications, Health & Wellness, and Environmental Quality.
- Opportunity includes: Personal Rights, Personal Freedom & Choice, Inclusiveness, and Access to Advanced Education.
Each component is made up of specific indicators that reflect real-life outcomes across the UK, helping to paint a comprehensive picture of social progress at the local level.
How can this data be used by local governments, businesses, or community organizations?
This data can be highly valuable for local governments, businesses, and community organizations by helping them make more informed, targeted decisions. For local governments, it enables the identification of gaps in community wellbeing, allowing for smarter resource allocation, ongoing monitoring of outcomes, and the setting of clear, evidence-based policy goals. Over time, the data supports benchmarking to track progress or decline, helping to assess the impact of interventions. For community groups and NGOs, it can highlight unmet needs, guide service delivery, and strengthen funding bids or lobbying efforts by backing proposals with credible evidence. Businesses can use the data to understand local challenges and opportunities, ensuring their operations and partnerships align with community priorities.
Can I compare Social Progress Index data with other datasets (e.g., economic growth, crime rates, education levels)?
Yes! Navigate to Charts and select Scorecard; here you can view the Social Progress Index score and compare this to different indicators. You can also compare and select certain indicators to compare on the Indicator Comparison (also under Charts).
How does Place Insight ensure data accuracy and reliability?
Place Insight ensures data accuracy and reliability by following the OECD’s Handbook on Constructing Composite Indicators, a globally recognized guide for developing high-quality indices. This involves carefully selecting valid and relevant indicators, standardizing data to make it comparable, applying transparent weighting and aggregation methods, and conducting sensitivity analysis to test the robustness of results. The process also includes clear documentation of all sources and assumptions, helping to build trust and ensure the data is both credible and useful for decision-making.
Technical Aspects
Is there an API to access the data programmatically?
No, this function is not available.
What should I do if I encounter an error or missing data?
Please get in touch with admin@impera-analytics.com
Can I integrate this tool with other GIS platforms or data analysis software?
No, this function is not available.
Are there any system requirements to use Place Insight?
Each user must have a Power BI Pro Licence and that’s it!
Support & Next Steps
Who can I contact for more information or support?
Contact admin@impera-analytics.com for any queries related to Place Insight.
Can I contribute data or insights to improve the Social Progress Index?
Yes! Impera is always happy to receive feedback and insights.
Is there a way to receive updates or reports on social progress in my region?
Currently, we don’t have an automated update function within the platform but users have access for a year which they can use to continually monitor progress.
Place Insight Follows the OECD’s Best Practice Standard
Place Insight Follows the OECD’s Best Practice Standard
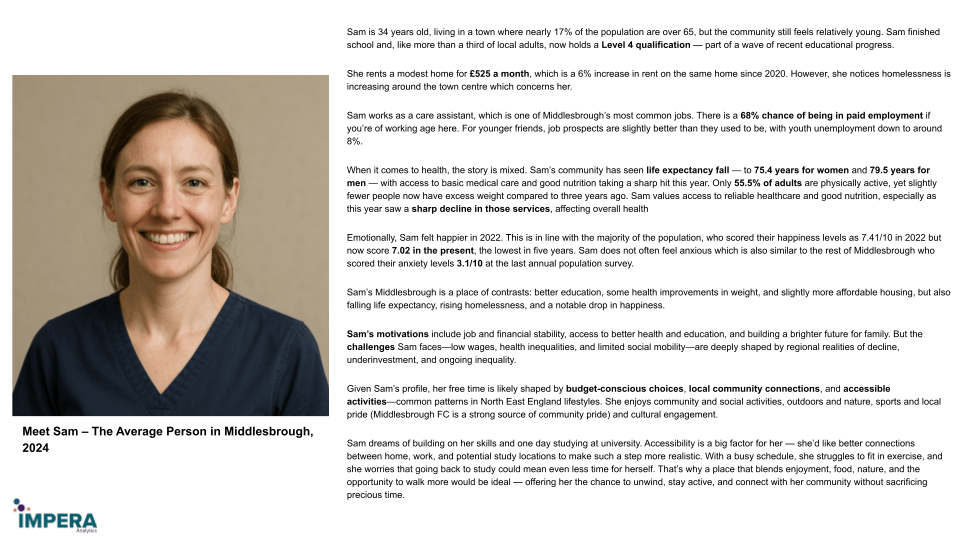
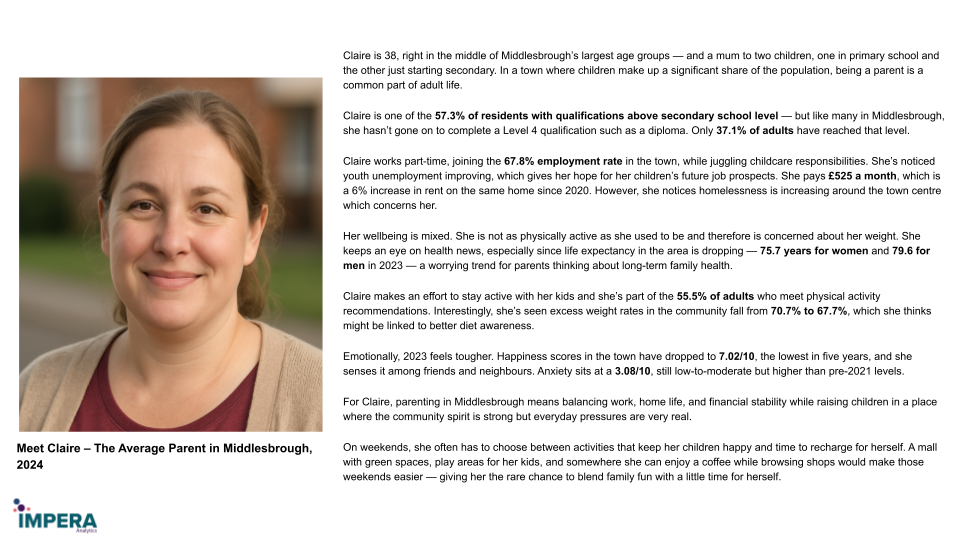
This section showcases how Place Insight data has been used to create personas for Middlesbrough. The personas are not intended as definitive representations of residents, but as illustrative examples of the kinds of insights Place Insight can generate when local data is translated into clear, human-centred stories.
The purpose is to demonstrate the capability of Place Insight—how it can combine multiple datasets, highlight different experiences within a community, and present findings in a way that supports decision-making, service design, and communication.
By turning data into relatable narratives, we can show how Place Insight helps organisations move beyond numbers to a richer understanding of people and places.